CSCI 150 - Lab 3
Diagnosing Heart Disease
Overview
In this lab we will use conditionals to divide objects into different categories based on patterns in data.Materials
Description
 While the formal system of Boolean logic was developed by
George Boole,
the study of logic has roots as far back as Ancient Greece and
Aristotle and his foundational work on
Syllogisms. Our ability to reason
logically and rationally is often cited as a primary indicator of our intelligence, not only on an
individual level as measured by SAT and IQ tests, but also on a species level to distinguish our
actions and behaviors from other organisms. Today we will spend
our lab understanding the basics of intelligence.
While the formal system of Boolean logic was developed by
George Boole,
the study of logic has roots as far back as Ancient Greece and
Aristotle and his foundational work on
Syllogisms. Our ability to reason
logically and rationally is often cited as a primary indicator of our intelligence, not only on an
individual level as measured by SAT and IQ tests, but also on a species level to distinguish our
actions and behaviors from other organisms. Today we will spend
our lab understanding the basics of intelligence.
Artificial Intelligence (AI) is a field within computer science with the goal of recreating, through the use of a computer, the intelligence we see in human behavior. The goal of AI has yet to be achieved in a broad sense, but much progress has been made in the fields of logic and categorization. We tackled deductive reasoning with logic puzzles, deducing a conclusion of what must be true from the facts presented to us. Today we'll focus on inductive logic: our ability to make generalizations based on data and apply these general rules to new situations.
Step 1
Imagine you are tasked by the Cleveland Clinic to help them train new doctors to diagnose patients with heart disease. They have been reviewing their past patient histories and started to notice some patterns after narrowing their focus to a few key features of each patient. They show you some histograms, where the patients with heart disease are labeled red, and those without are labeled blue.
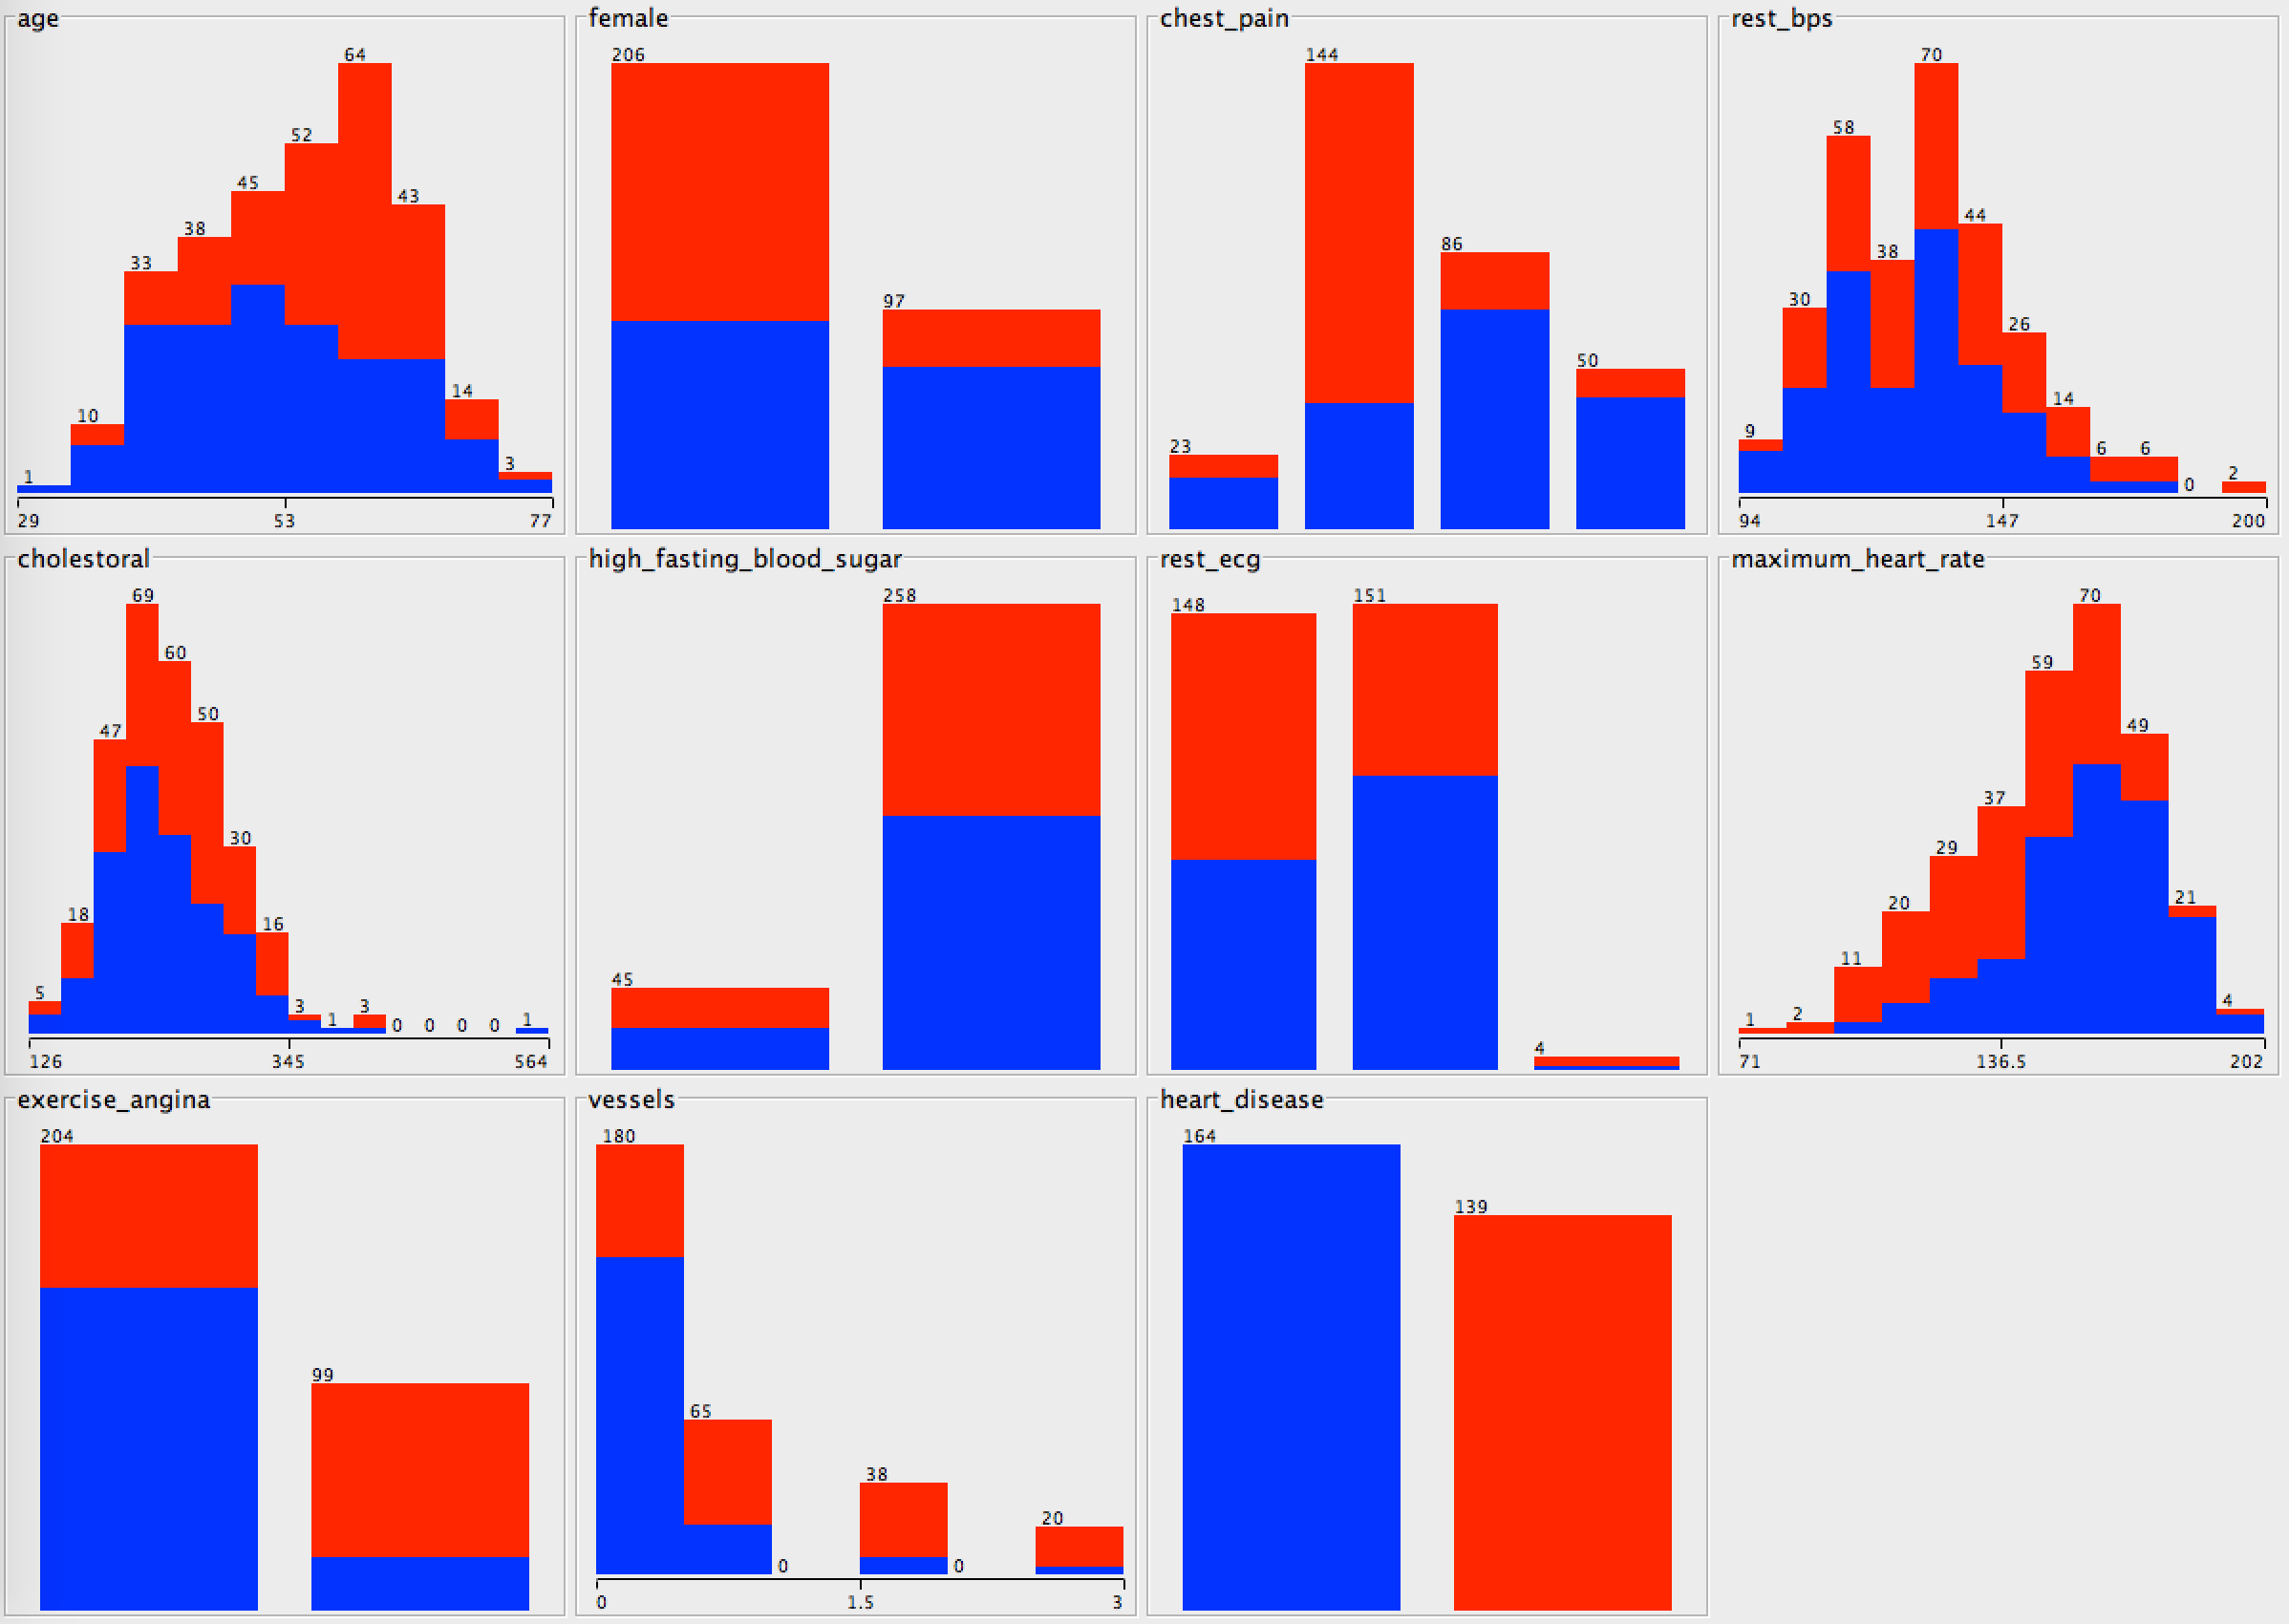
They also give you some more detailed information about these features. For example, the "female" attribute can be True or False. False is shown on the left of this figure, since the values are sorted alphabetically.
- age: age in years (int)
- female: true if female patient (bool)
- chest_pain: four types of chest pain were recorded (string)
asymptomaticatypical anginanon-anginal paintypical angina
- rest_bps: resting blood pressure in mm Hg on admission to the hospital (int)
- cholesterol: serum cholesterol in mg/dl (int)
- high_fasting_blood_sugar: true if > 120 mg/dl (bool)
- rest_ecg: resting electrocardiographic results (string)
hypertrophynormalwave abnormality
- maximum_heart_rate: maximum heart rate achieved (int)
- exercise_angina: exercise induced angina (bool)
- vessels: number of major vessels (0-3) colored by flourosopy (integer)
- heart_disease: doctor's diagnosis of heart disease (bool)
What conclusions can you draw about the data from the histograms above? Write at least three hypothesis or inferences to summarize these charts, and record them in a Lab Evaluation document.
Step 2
They next present you with the following ten example patients, listing off their features. They would like a way to make decisions about newly admitted patients which is based on this table, and simple enough for someone to remember the rule. They are hoping that the rules you generate on these ten patients will generalize to their whole dataset of over 300 patients.
| age | female | chest_pain | rest_bps | cholesterol | high_fasting_blood_sugar | rest_ecg | maximum_heart_rate | exercise_angina | vessels | DISEASE |
|---|---|---|---|---|---|---|---|---|---|---|
| 63 | False | typical angina | 145 | 233 | True | hypertrophy | 150 | False | 0 | False |
| 67 | False | asymptomatic | 160 | 286 | False | hypertrophy | 108 | True | 3 | True |
| 67 | False | asymptomatic | 120 | 229 | False | hypertrophy | 129 | True | 2 | True |
| 37 | False | non-anginal pain | 130 | 250 | False | normal | 187 | False | 0 | False |
| 41 | True | atypical angina | 130 | 204 | False | hypertrophy | 172 | False | 0 | False |
| 56 | False | atypical angina | 120 | 236 | False | normal | 178 | False | 0 | False |
| 62 | True | asymptomatic | 140 | 268 | False | hypertrophy | 160 | False | 2 | True |
| 57 | True | asymptomatic | 120 | 354 | False | normal | 163 | True | 0 | False |
| 63 | False | asymptomatic | 130 | 254 | False | hypertrophy | 147 | False | 1 | True |
| 53 | False | asymptomatic | 140 | 203 | True | hypertrophy | 155 | True | 0 | True |
We will be adding our logical rules to a file called
analysis.py. This program will ask the user for a data file, and then try
predict if each patient in the file has heart disease. The results will display the
percent accuracy of these predictions. In addition, it will break down the predictions
into four categories:
- True Positives - These patients have heart disease and were predicted correctly
- False Positives - These patients do not have heart disease and were predicted incorrectly
- True Negatives - These patients do not have heart disease and were predicted correctly
- False Negatives - These patients have heart disease and were predicted incorrectly
Find the section labeled BEGIN PREDICTION CODE. Notice that there is one line in this section, which will predict that every patient will have heart disease.
Create a project in PyCharm called "lab3" and download into this folder the analysis.py file
along with the training and testing sets linked below.
Run this code with the training data given (saved in cleveland-training.csv).
What is the accuracy? Also run this code with the testing data given (saved in cleveland-testing.csv).
Step 3
We will now use what you know aboutif-elif-else statements to
edit this python program and better classify a given patient.
Consider the following hypothesis: "Males get heart disease, and females do not get heart disease." Translated into a formal logical statement, we would write the following code:
if female:
    prediction = False
else:
    prediction = True
Run the analysis code with this rule, and record the accuracy on the training and testing set.
Step 4
While this is an improvement over the default answer, we can do better. Write three separate attempts at a rule, looking at the training data given in the table above, and in each case limiting yourself to only use the features listed.For each version, use "File -> Save As" in PyCharm to create a new copy of the file. The filename to use for each one is given below.
- age and female (
analysis_4a.py) - maximum_heart_rate and chest_pain (
analysis_4b.py) - vessels, exercise_angina, and rest_ecg (
analysis_4c.py)
Step 5
You should notice above that you can get very high accuracy on the training set and still have low accuracy on the testing set. In fact, you could write a rule individually for each example in the training set to get 100%, but this would have very low generalization. This is known as overfitting.A common way to combat overfitting is to recognize that you are also trying to minimize the description length of your rule set, similar to the idea of Occam's razor that the simplest explanation is often the best.
As the final piece of this lab, try to find the highest accuracy ruleset on the testing
set, but limiting yourself by the number of lines of code you write. What is the highest
accuracy you can achieve with 10 lines of code? How about 20? Feel free to look at the
whole dataset to try and generate your hypotheses, and record your solutions in your writeup.
Write up your code in a file called analysis_5.py.
What To Hand In
Hand in your files using the usual turn-in form. Write the results of each step above in an evaluation document.You must hand in:
analysis_4a.pyanalysis_4b.pyanalysis_4c.pyanalysis_5.py- Lab Evaluation
Grading
- To earn a D, do the above and complete Steps 1 and 2.
- To earn a C, do the above and complete Step 3.
- To earn a B, do the above and complete Step 4.
- To earn an A, do the above and complete Step 5.
- To earn a 100, do the above and follow the style guide exactly.